Monday, May 16, 2016

Unit 7 Balance of Payments


Measure of money inflows and outflows between the United States and the res of the world (ROW)
-Inflows are referred to as credit
-Outflows are referred to as debits

The Balance of Payments is divided into 3 accounts
  • Current Account
  • Capitol Financial Account
  • Official Reserves Account
Current Accounts
  • Balance of Trade or Net Exports
    • Exports of goods and services - Imports of good/services
    • Exports create a credit to the balance of payments
    • Imports create a debit to the balance of payments
  • Net Foreign Income
    • Income earned by U.S. owned foreign assets-Income paid to foreign held U.S. assets
    • Ex: Interest payments on German and U.S.s Treasury bonds
  • Net Transfers (tend to be unilateral)
    • Foreign Aid = a debit to the current account
    • Ex: Mexican migrant workers send money to family in Mexico

Capitol Financial Account
  • The balance of capitol ownership
  • Includes the purchase of both real and financial assets
  • Direct investment in the United States is credit o the capital account
  • Ex: Toyota factory opens in San Antonio, Texas
  • Direct investment by U.S. firms / Individuals in a foreign country are debits to the capital accounts
  • Ex: Intel factory in San Jose, Costa Rica
  • Purchase of foreign financial assets represents a debt to the capital account . Ex: Warren Buffet buys bonds in petro Chan
  • Purchase of domestic assets by foreigners represents a credit to the capital account. Ex: United Arab Emirates sovereign wealth fund purchases a large stake in NASDAQ.
Relationships between Current and Capital Account
  • Remember double entry bookkeeping?
  • The current account and capital account should zero out
  • That is... if the current account has a negative balance (DEFICIT), then the capital account should then have a positive blance (Surplus)
Official Reserves
  • The foreign currency hodings of the United States Federal Reserve System
  • When there is a balance of payments surplus, the fed accumulates foreign currency and debits the balance of payments
  • When there is a balance of payments deficit the fed depletes its reserves of foreign currency and credits the balance of payments.
  • The official reserves zero out the balance of payments

Active or Passive Official Reserves
  • The U.S. is passive in its use of official reserves. It does not seek to manipulate the dollar exchange rate
Balance of Trade : Goods  + Goosds
                              Exports    Imports

Balance on goods and services
Goods + Services + Goods + Service
Exports   Exports     Imports   Imports

Current Account:
Balance on goods and services
                    +
  Net investment
                     +
   Net Transfers

Capital Accounts:
Foreign Purchase, Domestic Purchases

Balance of Payments

Mechanics of Foreign Exchange
Foreign Exchange
  • Buying and selling of currency
 Ex; In order to purchase souvenirs in France, it is first necessary for Americans to sell their dollars and buy Euros
  • Any translation that occurs in the Balance of Payments necessities. Foreign exchange
  • Exchange rate is determined in the foreign currency markets
Changes in Exchange Rates
  • Exchange rates are a function of the supply and demand for currency
  • An increase in the supply of a currency will decrease the exchange rate of currency
  • A decrease in supply of a currency will increase the exchange rate of a currency
  • An increase in demand for a currency will increase the exchange rate of a currency
  • A decrease in demand for a currency will decrease the exchange rate of a currency.
Appreciation and Depreciation
  • Appreciation of a currency occurs when the exchange rate of that currency increases
  • Depreciation of a currency occurs when the exchange rate of that currency decreases
  • ex: If German tourist flock to America to go shopping, the supply of Euros will increase and the demand for dollars will increase. This will cause the Euros to depreciate and the dollar to appreciate.

Exchange Rate Determinate
  • Consumer Taste
  • Relative Income
  • Relative Price Level
  • Speculation
Exports and Imports
  • The Exchange rate is a determinate of both export and imports
  • Appreciation of the dollar causes American gods to be relatively more expensive and foreign goods to be relatively cheaper thus reducing exports and increasing imports
  • Depreciation of the dollar causes American foreign goods to be relatively more expensive thus increase exports and reducing imports
Floating Rate/Flexible Rates
  • Depends upon supply and demand of that currency vs other currency
  • Very sensitive to the business cycle
  • Provides options for investments
*FLOATING RATES ARE NEVER THE SAME PER DAY*

Fixed Rates
  • Based Upon a country's willingness to distribute currency and the ability to control the amount
  • *U.S. controls our money so it doesn't grow out of control
                                                                       
                                                                     Absolute Advantage
Individual- exists when a person can produce more of a certain good/ service that someone else in the same amount of time (or can produce a good using the least amount of resources)

National - exists when a country can produce more of a good/ service than another country can in the same time period.


                                                                  Comparative Advantage
  • A person or a nation has a comparative advantage in the production of a product when it can produce the product at a lower domestic opportunity cost than can a trading partner
Output ex: Tons per acre, miles per gallon, words per minute, apples per tree, televisions produced per hour

Input ex: # of hours to do job, # of acres to feed a horse, # of gallons of paint to paint a house

                                                                      Specialization and Trade
  • Gains from trade are based on comparative advantage and not absolute advantage.


Saturday, May 14, 2016

Unit 5 and 6

Short Run Aggregate Supply

Short Run Aggregate demand
  • Period in which wages ( and other input prices) remain fixed as price level increases or decreases

Effects over short run
  • Price level changes allow for companies to exceed normal outputs and hire more workers because profits are increasing while wages remain constant
  • In long run, wages will adjust to price level and previous output levels will adjust accordingly
Equilibrium in the extended model
  • Inclusion of both short run and long run aggregate supply
  • long run curve is representative of natural rate of unemployment
Demand Pull Inflation in AS model
  • Demand Pull Prices - Prices increase based on increase in aggregate demand
  • Short run- demand pull will drive prices up and increase production
  • Long run- increases in aggregate demand will eventually return to previous levels
  • Demand Pull Inflation

Cost Push and the extended model
Dilemma for Government
  •  In an effort to fight cost push, the government can react in two different ways:
  • Action such as spending by the government could begin an inflationary spiral
  • No action however could lead to recession by keeping production and eployment levels declining.

The Phillips Curve


  • Because Long Run Philips Curve (LRPC) exists at the natural rate of unemployment (Un) structural changes in the economy that affect Un will also cause the LRPC to shift
  • Increases in Un will shift LRPC to right
  • Decrease in Un will shift LRPC to left
                                                                 Relation to AS/AD
changes in AS/AD model can also be seen on the Philips curve   *MIRROR IMAGES*

  • LRPC occurs at natial rate of unemployment
  • Always represented by a yellow line
  • There is no tradeoff between unemployment and inflation
  • LRPC will only shift if LRAS shifts
  • If Natural Rate of Unemployement (NRU) changes, so does LRPC
  • NRU = frictional + structural + seasonal unemployment (4% to 5%)


Major LRPC assumpltion is that more workers benefits create higher natural rates and a few workers benefits create lower natural rates

Misery Index
  • Combinstion of Inflation and Unemployment in any given year
*Single digit money is good*
ex : inflation 2% and unemployment 4% economy is relatively good

Supply Shocks
  • Rapid and significant increase in resource cost
              *caused by war, weather, tax, etc*

Supply Side Economics
  • Changes in AS and AD are the main active force in determining the level of unemployment rates, inflation, and economic growth.
  • supply side economics

Supply Side Economist
  • Support policies that promote GDP growth by arguing that high marginal tax rates along with the current system of transfer payments such as unemployment compensation or welfare programs provide disincentives to work, invest, innovate, and undertake entrepreneurial ventures

Incentives to Save and Invest
  1. High Marginal Tax Rates
         - Reduce the incentive for savings and investments

     2.   Consumption

         - Might increase but investments depend upon saving

     3.    Lower Marginal Tax Rates

         - Encourage saving and investment


Laffer Curve

  • Theoretical relationship between tax rates and tax revenues
  • As tax rates increase from zero, tax revenue increases from zero to some max levels and then declines
  • Laffer Curve Explained


3 conditions of Laffer Curve
  1. Evidence suggests that the impact of tax rates on incentives to work, save, and invest are small
  2. Tax cuts also increase demand which can fuel inflation and demand may exceed supply
  3. Where the economy is actually located on the curve is difficult to determine

Friday, April 8, 2016

Tools of Monetary Policy

1. Reserve Requirement
 -only a small percent of your bank deposit is in the safe. The rest of your money has been loaned out "Fractional Banking "
- FED set the amount that banks must hold
- Reserve Requirement (reserve ratio) is the % of deposits that banks must hold in reserve and not loaned out

  • When the FED incr money supply it increase the amount of mkney held in bank deposits
If recession , FED should decrease reserve ratio 
  1) Banks held less money and have more excess
  2) Banks create more money by loaning out excess
  3) Money supply increase interest rates fall,  AD increase

If inflation, FED should increase Reserve Ratio
1) Banks held more money and have less excess
2) Banks create less money
3) Money supply decrease, interest rate increase, AD decrease

2) The Discount Rate
- interest rate FED charge commercial banks
Ex: if Bank of America needs $10 mil, they borrows it from the U.S Treasury which FED controls but they must pay it back with interest

To increase money supply the FED should decrease the Discount Rate (Easy money policy)

To decrease money supply the FED should increase the Discount Rate (Tight money policy)

*FDIC banks are the only ones using Discount Rate. They do not want it.

3) Open Market Operations
  • FED buys/ sells government bonds (securities)
  • The is the most important and widely used monetary policy
To increase money supply, FED should buy government securities

To decrease money supply, FED should sell government securities 

Buying bonds means bigger money supply 
Selling bonds means smaller money supply

Federal Funds Rate
* FDIC membe banks loan each other overnight funds (Banks to Bank)

Prime Rate 
*Interest Rate that banks charge their most credit worthy customers


When a customer deposits cash or withdraws cash from their demand deposig acct. It has no effect on money supply

Single Bank - Loan money from Excess Reserves

Banking System - ER x multiplier x Total money supply

When the FED buys or sells bonds, ER is create

It only changes:
1)Composition of money
2) Excess Reserves
3) Required Reserves

What Banks Do

A bank is a financial intermediary
-Use liquid assets (ie banks deposits) to finance the investments of borrowers
* Process is known as fractional reserves banking
- A system in which in whicb depository institutions hold liquid assets less than the amount of deposits
- Can take the form of
  1. Currency in bank vaults
  2. Bank Reserves - deposits held at the federal reserve

T Account- banking sheet to measure banks liabilities versus their assets
-Items whicht the bank holds legal chain
-The use of funds by financial intermediaries liabilities (Amount owed)
- The legal claims against banks
- The amounts of funds for financial intermediaries
12 district federal reserve banks
- Quasi owned (owned by members)
-Not directly owner by fed
-people sit on the board who are elected by prez


Function of Fed
*Issues currency to population
* Sets Reserve Requirement and holds reserves of banks
*Lends money to bank and charge interest
*Check clearing service for banks
*Act as personal bank for governments
*Supervise member banks
*Control money supply in economy

Functions of the Federal Reserve

Thursday, April 7, 2016

Time Value of Money

Is a dollar today worth more than a dollar tomorrow"
- Yes because of inflation and opportunity cost.
V=future value of $
p=present value of $
r= real interest rate (nominal rate-inflation rate) expressed as a decimal
n=years
k=number of times interest is credited per year

Simple Interest Formula
  • v= (1+r)^n x p
Compound Interest Formula
  • V= 91+r/k)^nk x p
Calculate future value of money
Step 1:Calculate the real interest rate
          r% = I% - pie%
Step 2 : Use the simple interest formula to calculate the future value of the $
v = (1 + r )^n x p

Demand for money has an inverse relationship with nominal interest rate and the quantity of money demanded

  1. What happens to the quantity demanded of money when interest rates increase?
 - Quantity demanded falls because individuals prefer to have interest earning assets instead of borrowed liabilities.

     2. What happens to the quantity demanded when interest rates decrease?
  - Quantity demanded increases. There is no incentive to convert cash into interest earning assets.


Money Demanded Shifters
  1. Changes in price level
  2. Changes in income
  3. Changes in taxation that affect investment

Increasing Money Supply
If Fed increases the money supply, a temporary surplus of money will occur at 5% interest. Surplus will cause interest rates to all to 2%

Increasing money-> Decreasing interest rate -> Increasing investment-> Increase in AD

If the FED decreases the money supply, a temporary shortage of money will occur at 5% interest. The shortage will cause interest rates to rise to 10%

Decrease money supply -> Increase interest rate-> Decrease investment -> Decrease AD

Financial Sector

Financial Assets                                                                          
-Stocks and Bonds   
whose benefit to the owner
depends upon
the issuer of the asset
meeting certain oblogations

Financial Liablities
- Liabilities incurred by the issuer of a financial asset to stand behind the issued asset

Interest rate:  price paid for the use of a financial asset


Stocks
- Financial asset that conveys ownership in a corporation

Bonds
- Promise to pay a certain amount of money plus interest in the future

Sunday, March 27, 2016

Money And Banking/Monetary Policy Video Notes

Video 1
There are three different types of money: Commodity money, Representative money, and Fiat Money. Commodity money is a good that has multiple purposes that also functions as money. When cows are traded in other countries, cows are being used as commodity money. This is not the most durable type of currency, but it is the oldest type of money in history.
Representative Money means whatever is being used as currency represents a specific quantity of a precious metal. Using a gold standard is a representative system. Dollar bills represented a quantity of silver or gold. The problem with this system was that when the value of the metal changes, the value of the currency that represents that metal will fluctuate as well. It is an unstable system.
Fiat money is legal tender that is backed by the word of the government that it has value. Because the government said it has value, it becomes worth something. The dollar bill today is fiat money.
There are three functions of money: as a medium of exchange, store of value, and as a unit of account. Through money, exchanges happen. When you buy something, an exchange is happening. Money functions as a store of value because when it is stored, it is expected to still have value and be stable while it is in the bank. Money is a unit of account because when we look at price, we see it as a value of worth. Something that is more expensive is usually seen as higher quality.

Video 2
Money Market graph is one that will pop up often on the AP Exam. To draw it, the first thing one must do is label your axis. The Y axis of the money market graph is Interest rate (I). Interest is the price incurred when one borrows. The axis is Quantity of money ( Qm). Demand (Dm) will always slope downward because when the price is high, the quantity demanded is low. That is the Law of Demand. When the interest rate is low, people will borrow more. The supply of money is verticle because it does not vary based on the interest rate. Demand for money is based on interest rate, supply of money is fixed and does not move unless the Fed moves it. If there is an incentive for people to want more money, like a tax credit or some other subsidy, that would increase demand for money. An increase of Demand is a shift to the right, a decrease is a shift to the left. If the demand of money fluctuates, that would put upward pressure on interest rates. The fed can counteract that upward pressure by increasing the money supply. The fed will try to stabilize interest rates because if they are unstable, you cannot predict the level of investment, you cannot predict the level of consumer spending, and you cannot manipulate aggregate demand to give the right level of economic change that the time demands.

Video 3
The Fed has 3 tools of monetary policy. With those three tools, the Fed can use Expansionary technique ( Easy $) or Contractionary technique ( tight $) The Fed can manipulate the reserve requirement which is the percentage of the banks total deposits that they must keep. This could be volt cash or on reserve with a Federal bank. If the Fed wants to increase the money supply, they will lower the required reserves so that banks can use that money as excess reserves and lend it out. If they want to decrease money supply, banks will raise the required reserves, thus having less money to loan out. The second tool is the Discount Rate. This is the rate at which banks can borrow money from the Fed. This is the interest rate that the Fed charges banks to borrow money. The Fed is a Lender of Last resort because banks borrow from the Fed if they are in serious trouble. If the Fed wants to increase the money supply, the Fed will lower the discount rate. If the Fed wants to decrease the money supply, they will increase the discount rate. This is not that affective because just because the rate is lowered, does not mean the banks have to borrow money. The third tool the Fed has to control monetary policy is the ability to buy and sell bonds and treasury securities. This is specifically government bonds and government issued securities. To increase the money supply, the Fed will buy bonds. To decrease the money supply the Fed will sell bonds because then the public will buy the bonds and the Fed will take the money and keep it, thereby decreasing the amount of money in circulation. The part of the FED that makes decisions involving the Fed in open market operations is the FOMC. The Federal Funds rate is the rate that banks borrow money from one another. When the fed buys bonds, it put downward pressure on the Federal Funds rate and vice versa.

Video 4
The Loanable Funds graph must be tied to the money market and show the results in Aggregate Demand and Aggregate Supply. Loanable funds is the money that is available in the banking system for people to borrow. The first step is to label the axis. The Y axis is interest rate and the X axis is quantity of loanable funds. Demand of loanable funds is downward sloping because when the interest rate is higher, people have a disincentive to borrow and vice versa. Supply slopes upward on the graph. Supply of loanable funds is dependent on savings because it comes from the amount of money people have in banks. The more people save, the more money banks have available to loan out to businesses and whatnot, creating business. If people have incentives to save more, we increase the supply of loanable funds with a shift to the right. If people have disincentives to save, we decrease the supply of loanable funds with a shift to left. When the government runs a deficit, they are demanding money in order to spend it. On the graph we would show this as an increase in the demand for loanable funds. You could also show it by decreasing the supply because that would be reducing the national supply of money.

Video 5
The money creation process is how banks add more money into the money supply. Banks create money by making loans. One of the banks tools is the reserve requirement. The money multiplier is used in conjunction with the reserve requirement to find the total amount of money created in a system. The formula for this is 1/ RR. You then multiply that by the amount of the loan, thus finding the total amount of money created in the system. We got this increase of the money from the loan through the process of multiple deposit expansion. One loan to a person goes into their bank and the money will continue to be loaned out to new people, with multiple banks taking out a required reserve percentage thus creating an estimated total amount of money. If any of the banks hold excess reserves, that will decrease the total amount of money created.

Video 6
One must show the connection between the Money Market, Loanable Funds Market, and the Aggregate Demand/Aggregate Supply market. For example if the government running a deficit, they will borrow money from the citizens. When citizens buys a government security, that is a person loaning their money to the government. In the money market, this would be shown as an increase in the demand for money, a right shift on the demand . Interest rate would increase and quantity remains the same because supply is fixed. On the loanable funds graph, the government would be demanding more loanable funds so demand shifts to the right. which would increase interest rates. This causes an increase in government spending, which would increase aggregate demand on the Aggregate Demand/ Aggregate Supply graph, thus increasing price level and an increase in GDP. A change in the supply of money causes a change in the price level. The Fisher Effect says that interest rates and price level have to be equivalent.

Wednesday, March 9, 2016

Saving, MPC, MPS, APC, AND Multipliers

Saving

  • When household is NOT spending
  • The ability to save isome constrained by :
        - The amount of disposable income
        - The propensity to consume
Do households save if DI = 0
   Answer: NO


Average Propensity to Consume (APC)
Average Propensity  to Save(APS)

  • APC + APS = 1
  • 1- APC = APS
  • 1-APS = APC
  • APC>1= DISSAVING
  • -APS=DISSAVING
Marginal Propensity to Consume (MPC)
  • Fracation of any change in disposabless income that is consumed
  • MPC = change in consumption ÷ change in disposable income 
Marginal Propensity to Save (MPS)
  • Fraction of any change in disposable inco,email that is saved
  • MPS = change in savings ÷ change in disposable income
MPC +MPS =1
MPC = 1-MPS
MPS = 1- MPC


PEOPLE DO TWO THINGS WITH DISPOSABLE INCOME  :  CONSUME OR SAVE

Spending Multiplier Effect
  • An initial change in spending (C, Ig, G, Xn) causes a larger change in aggregate spending or aggregate demand
  • Multiplier : change in AD ÷ change in spending
Calculating spending multiplier
  • Can be calculated from MPC OR MPS
  • Multiplier = 1÷ (1-MPC) OR 1÷MPS
  • multipliers are positive when  there is an increase in spending and negative when there is a decrease
Calculating tax multiplier 
  • When government taxes, the multiplier works in reverse because now money is leaving the circular flow
  • -MPC÷1-MPC or -MPC÷MPS
  • If there is a tax cut then the multiplier is positive because there is more money in the circular flow

Disposable Income and Consumption

Disposable Income
  •  Income after taxes or net Income
  • DI= Gross Income - Taxes
2 Choices
 - with disposable income, households can either:
  • Consume: spend money on goods and services
  • Save ( not spend money on goods and services 
Consumption
  • Household spenosing 
  • The ability to consume is constrained by:
             - The amount that of disposable income
             - The propensity to save
  • Do households consume if DI = 0?
       - Autonomous consumption
       - Dissaving


SRAS

Nominal wages- amount of money recieved by a worker per unit of time
r%= 1% -inflation rate

Real wages- amount of goods and services a worker can purchase with their nominal wage
( purchasing power of nominal)

Sticky Wages- Nominal wage level that is set according to an initial price level. does not vary due to labor contractions or other restrictions.

Inflation demand curve- downward sloping
Why? - when interest rates are high, fewer investments are profitable, when iterest rates were low, more investments are profitable.
 Interest Rates and Investment Demand
- Money spent on expenditures on:

  • new plants ( facilities)
  • capitol equipment (machines0
  • technology ( hardare and software)
  • inventories ( goods sold by producer)
  • new homes

How does business makes investment benefits

  • Cost (benefits)
How does business determine the benefits

  • expected rate of return 
How does business count the cost
http://www.showme.com/sh/?h=krhN9wO
  • interest cost
How does business determine the amount of investment they take
-  compare expected value of return to interest cost
  • if expected return is greater than interest then they will invest
  • If expected return is lower than interest cost then they do not invest
SHIFTS IN DEMAND

  •  Cost of Production
       - Lower cost shifts ID right
       - Higher cost shifts ID left
  • Business Taxes
       - Lower business taxes  shifts ID right
       -Higher business taxes shifts ID left
  • Technological change 
        - New technology shifts ID right
        - Lack of technological change shifts I'D left


  • Stock of capitol
       - If an economy is low on capitol then ID shifts right
       - If an economy has much too capitol then I'D shifts
  • Expectations
       - Positive expectation shifts ID right
       - Negative expectations shift ID left

Friday, March 4, 2016

Aggregate Supply

Long Run vs Short Run

Long run:

  •  period of time where input prices are completely flexible and adjust to charges in price level
In the long run, the level of Real GDP supplied is independent of price level
Short Run :
  • Period of time where input prices are sticky and do mot adjust to changes in the price level
  • In the short run the level of Real GDP supplied is directly related to the price level
Long Run Aggregate supply of LRAS marks the level of full employment in economy 
( analogous to the ppc)
Because input prices are COMPLETELY flexible in the long run, changes in price level do not change firms real profits and therefore do not change firm's level of output. This means that the LRAS is vertical at the economy's level of full employment.
Yf, Y*, FE = Full Employment
Changes in SRAS (short run aggregate supply)
  - increase = shift to right
  - decrease = shift to left
Key to understanding shift in SRAS is per unit cost of production
Per unit cost of production = total input cost/ total output

Determinates of SRAS
 1) Input Prices:
 - Domestic Resource Prices - 75% business cost , wages, cost of capitol, raw materials
- Foreign Resource Prices
Aggregate supply intro
- Market power
 Increase in resource prices = SRAS shift to left
  Decrease in resource prices = SRAS shift to Right
Productivity
Productivity = total output/ total input
More Productivity - lower unit production cost = SRAS shift right
Lower Productivity - Higher unit production =SRAS shift to left


Aggregate Demand Curve


  • AD is demand by consumers, businesses, government, and foreign countries.
  • Changes in price level cause movement along the curve
  • AD = C + Ig + G + Xn
Why is AD downward sloping?
   1) Real Balance Effect

          - Higher price levels reduce the purchasing power of money
          - The decreases the quantity of expenditures
          - Lower price levels increase purchasing power and increase expenditure
  Ex: Your bank balance is $50,000 but Indian erodes your purchasing power, causing you to reduce your spending

  2) Interest - Rate Effect
         - When the price level increases, lenders get a REAL return on their loans.
        - Higher interest rates discourage consumer spending and business investment
Ex: An increase in prices leads to an inverse in the interest rate from 5% to 25%. You are les likely to take out loans to improve your business

   3) Foreign Trade Effect
      -When U.S piece levels rise, foreign buyers purchase fewer U.S goods and Americans buy more foreign goods
      - Exports fall and imports dude catsuit real GDP demanded to fall (Xn decreases)
EX : If prices triple in the U.S, Canada Will no longer buy U.S goods , causing quantity demanded of U.S products to fall

Price levels go up and GDP demanded goes down ( vice versa)

Shifters of Aggregate Demand
 GDP = C +Ig + G + Xn
   - There are 2 parts to a shift in AD
       1) A change in C, Ig, G, or Xn
        2) A multiplier effect that produces a greater change than the original change in the 4 components

Increase in AD = AD shift to the right
Decrease in AD = AD shift to the left

Determinates of AD
 1) Consumption
      - Household spending is affected by:                         a) Consumer Wealth
                   - more wealth = more.                                    spending/AD shift to right
                   - less wealth = less spending / AD.                shifts to left
                b) Consumer Expectations
                  - positive expectation =more.                          spending/ AD shifts to right
                  - Negative expectations = less.                     spending / AD shift to left
                 c)  Household indebtedness
                    - Less Debt = more spending / AD.                  shift to the right
                    - More debt = less spending / AD.                 shift to the left
                 d) Taxes
                  - Less Tax =more spending / AD.                   shift to right
                  - More Tax = less spending / AD                     shift to left
 2) Gross Private Domestic Investment
Investment spending is sensative to :
      a)Real Interest Rate
          - Lower Real Interest Rate = more investment ( AD shift right)
          - Higher Real Interest Rate = less investment ( AD shift left)
       b) Expected Returns
            - Higher expected returns = more investment ( AD shift right)
             - Lower expected returns = less investment ( AD shift left)

      Expected Returns are influenced by
         - Expectations of future profitability
         - Technology
         - Degree of excess capacity ( excess stock of capitol)
         - Business Taxes
 3) Government Spending
      - More government spending (AD shift right)
      - Less government spending (AD shift left)
 4) Net Exports
Net Exports are sensative to:
    a) Exchange Rate(international value of $)
        - Strong money = more imports and fewer exports ( AD left)
        - Weak money = fewer imports and more exports (AD shift right)
    b) Relative Increase
        - Strong foreign Economics = more exports ( AD shift right)
        - Weak foreign Economics = Less exports ( AD shift left)

Tuesday, February 9, 2016

Unemployement

Unemployment : Failure to use available resources, particularly labor, to produce desired goods and services

Unemployment Rate:  Standard 4%  to 5%
Formula:                      number of unemployed             
                   number of employed + number of unemployed


Types of Unemployment

Frictional Unemployment: Temporarily unemployed or between jobs

Structural Unemployment: Workers do not have transferable skills and their jobs will never come back

Seasonal Unemployment: Unemployed due to time of year and nature of job

Cyclical Unemployment: Unemployment from Economic downturn. As demand for goods and services fall, demand for labor fall.

Okun's Law
For every 1% that actual unemployment rate exceeds the natural rate of unemployment, a GDP gap of about 2% occurs


Labor Force
1. Above 16 years of age
2. Able and willing to work

Not in Labor Force
1. Military
2. People in jail/ prison
3. People in mental institution
4. Retired
5. Under 16 / students
6. Homemakers
7. People not looking for a job

Rule of 70
Used to determine how many years it takes for a value to double given a particular annual growth rate
ex: If you put $20,000 in the bank and it earns a yearly interest rate of 7% then how many years will it take for income to double.

answer : Take 70 and divide it by interest rate
70/7 = 10 years.

Real GDP and Nominal GDP

Real GDP
  - Value of output produced in constant base yea prices
  - It can increase only if quantity increases
  -Used to measure Economic growth

Nominal GDP
  - Value of output produced in current prices
  - It can increase from year to year if price and quantity increase
  - Used to measure price increases (INFLATION)


nominal vs real gdp

Nominal vs Real GDP

Formula for Real GDP and Nominal GDP is
P x Q
If base year is not given then use earliest year given

GDP Gap : The amount by which actual GDP falls short of Potential GDP

Calculating GDP Gap


GDP Deflator : Price index used to adjust from Nominal to Real GDP
          formula :                 Nominal GDP
                                             Real GDP      x 100
Consumer Price Index (CPI) : Most commonly used measurement of inflation for consumers
          formula :                  Current year
                                             Base year     x 100

Inflation formula:  GDP Deflator of current year - GDP Deflator if base year
                                                      GDP Deflator of base year                            x 100
In base year GDP deflator  = 100
 For years after base year GDP deflator > 100
  
Calculating Consumer Price Index

Caluclating GDP Deflator

calculating real GDP using a deflator


Interest: Tax on money that is borrowed
    Formula :       Real Interest Rate = Nominal Interest Rate - Inflation


Inflation
   - Taxes those who receive relatively fixed income
                 ie: welfare, social security

 Hurt By Inflation                                Vs                       Helped By Inflation
  1. Lenders                                                                           1.Debtors                                        
  2. Fixed income                                                                  2. Businesses where price of product
  3. Savers                                                                               increases faster than price of resources

Calculating rate of Inflation


Cost Of Living Adjustments (COLA) : Adjustment on pay to supplement income


Sunday, January 31, 2016

Circular Flow

Circular Diagrams represent transitions in an economy
      Has 2 Markets:
  1. Resource or Products Market- Place where households sell resources and businesses buy resources ( ALWAYS have goods and services flowing through)
  2. Factor Market- Factors of productions/ firms                                                                             IE: land, labor, capitol entrepreneurship
Firms- Organizations that produces goods and serviced for sale. They sell finished products to households.

Household- Person or a group of people that share their income. They sell their factors of production to businesses.
Circular Flow

GDP

GDP (Gross Domestic Product) is the market value of all final goods and services produced within a country's borders within a given year.

GNP( Gross National Product) is the total market value of all final goods and services produced by citizens of that country on its land or foreign land.

What's included in GDP
C- Personal Consumption expenditures
          *DOES NOT INCLUDE HOUSING*
Ig- Gross private domestic investment
                               This includes:
      • Factory Equipment
      • Factory Equipment maintenance
      • Construction of housing
      • Unsold Inventory of products  built in a year

G- Government Spending
      • Goods and Services
Xn- Net Exports
      • Exports- Imports
What's not included in GDP
  1. Intermediate goods: These are goods that require further processing before they are ready for final use.
    EX: Car engine, Radiator, Mirrors...etc 
  2. Used/ Second hand goods: These are goods that have already been counted in previous year so they are excluded to avoid double counting.
  3. Purely Financial Transactions ( Stocks and Bonds): They are excluded because they are not durable, countable goods and the return from the exchange may not be seen during that year.
  4. Illegal Activities ( drugs)
  5. Unreported Business Activities: They are not reported by people and cannot be tracked.        EX: Unreported tips
  6. Transfer Payments: These are Public (payments like ISS, Welfare, or Veterans payments) or Private (Scholarships or college funds)
  7. Non - Market Activity: These are volunteer activities, babysitting, or any work that may not result in payment.
Two Ways of Calculating GDP
Expenditure Approach: Add up all spending of final goods and services produced by the end of the year.
                   Formula: GDP= C+Ig+G=Xn
Income Approach: Add up all income that resulted from selling all final goods and services produced in a given year.
                    Formula: GDP= W+R+I+P+Statistical adjustments
W= wages
R= rents
I= Interest
P= Profits
Statistical Adjustments= Profits

Expenditure approach has to equal the Income approach

Compensation of Employees: This includes wages, salaries, fringe benefits, social security contributions and heath and pension plans.

Interest: Income of Property owners

Corporate Profits: Income of company stockholders

Proprietors Income: Income of sole proprietors (Entrepreneurs) and partnerships

Statistical Adjustments:
  1. Indirect Business Taxes
  2. Depreciation
  3. Net Foreign Factor Payments.

Net Domestic Product (NDP)
      *GDP- Depreciation*
Net National Product
      * GNP- Depreciation*

GNP=GDP + Net Foreign Factor Payment


Budget Surplus/ Deficit
Government purchases of goods and services + Government transfer payments - Government tax and fee collections

Trade Surplus / Deficit
Exports - Imports

National Income
 1. Compensation of Employees + Rental Income + Interest income + Corporate Profits + Proprietors Income
 2. GDP - Indirect Business Taxes - Depreciation - Net Foreign Factor Payments

Disposable Personal Income
National Income - Personal Taxes + Government Transfer Payments

Sunday, January 24, 2016

Business Cycle

Business Cycles occur all the time
  • once cycle is from trough to trough
  • Average cycle is 5 to 7 years
  • Recessions last about 14 months
  • Peaks: troughs are meaningless because we never know until it is over
  • Trough means end of recessions
  • If recession loses more than 10% of real GDP then it is a depression
Peak is the highest point of real GDP. It has the greatest spending and lowest unemployment. In this phase inflation is a problem.

Expansion- Real GDP is increasing.
Spending increases at this point and unemployment decreases

Contraction/Recession is when real GDP declines for 6 months. Unemployment increases and spending declines.

Trough is the lowest point of real GDP. It has the highest unemployment and the least spending.
Business Cycle

Price Ceiling and Price Floor

Price Ceiling occurs when the government puts a legal limit on how high the price of a product can be. Price Ceiling is only effective if it is set below equilibrium.
                                                        * Creates a shortage*
Ex: Rent Control

Price Floor is the lowest legal price a commodity can be sold at.  They are used by the government to prevent prices from being too low.
                                                        *Creates a surplus*
Ex: Minimum Wage

Equilibrium is the point at which the supply curve and the demand curve intersect. All resources are being used at this point.

Excess Demand occurs when the quantity demanded is greater than the quantity supplied.
                                                        *Creates a shortage*


Excess Supply Occurs when the quantity supplied is greater than the quantity demanded.
                                                         *Creates Surplus*


Friday, January 15, 2016

Demand and Supply

Demand - Quantities that people are willing and able to buy at various quantities
Law of Demand - There is an inverse relationship between price and quantity demanded

What Causes a "change in quantity demanded"?
            - Change in Price
What Causes a " change in demand"?
  1. Change in Buyer's Taste ( Advertisement)
  2. Change in number of buyers (Population)
  3. Change in price of related goods
    • Complimentary Goods
    • Substitute Goods
     4.   Change in Income
    • Normal Good- Increase in income that causes an increase in demand
                     (Can be Vice Versa)

    • Inferior Good- Increase in income causes fall in demand
                      (Can be Vice Versa)

Elasticity of Demand
- Measure of how consumers react to a change in price
  1. Elastic Demand

    • Demand that is very sensitive to a change in Price
                           E >1
    • Product is not a necessity and there are available substitutes
    • Ex: Soda, T-Bone Steaks, Car
     2.  Inelastic Demand

    • Demand that is not very sensitive to a change in price
                          E < 1
    • Product is a necessity and there are a few substitutes. People will buy no matter what.
    • Ex: Gas, Medicine, Salt, Soap, Milk
    3.  Unitary Demand
                         E = 1


HOW TO CALCULATE PRICE ELASTICITY OF DEMAND (PED)
          - 3 STEPS PED

  1. Calculate the quantity
          ( New Quantity- Old Quantity) / Old Quantity
      2. Calculate Price
           ( New Price- Old Price) / Old Price
      3. PED
           PED = (% of change in quantity demanded) / (% of change in price)


Supply
Supply - The quantities that producers or sellers are wiling and able to produce at various prices

Law of Supply - There is a direct relationship between price and quantity supplied

What Causes a "Change in quantity supplied"?
                                  - Change in price
What causes a "Change in supply"?
  1. Change in expectations
  2. Change in Weather
  3. Change in # of suppliers
  4. Change in cost of production
  5. Change in taxes or subsidies ( $ government gives to producers)
  6. Change in technology

Decreasing = Shift to the left
Increasing = Shift to the right

Supply shifts to the Left
  1. Cost of Production Increases
  2. Technology is down
  3. Taxes Increase
  4. Subsidies down/ taken away
  5. # of Sellers decrease
  6. Weather is bad
Supply shifts to the Right
  1. Cost of Production decreases
  2. Technology increases
  3. Taxes lowered
  4. Subsidies increase
  5. # of sellers increase
  6. Weather is good
Total Revenue (TR) - Total amount of money a firm receives from selling goods and services
  • Formula: P x Q = TR
Fixed Cost - A cost that does not change no matter how much of a good is produced
               ex: Mortgage, Rent, Insurance, Salary
Variable Cost - A cost that does not change no matter how much of a good is produced
               ex: Electricity Bill
Marginal Cost - Cost of producing one more unit of a good
*Different than Marginal Revenue*


Basic Understanding of Supply and demand

Factors of production and PPC

Factors of Production
- Resources required to produce goods and services
           1) Land - Natural Resources
           2) Labor - Workforce
           3) Capitol
                    2 types
                       - Physical Capitol- Tools, Machinery, Robots, Factory
                       - Human Capitol- Skills, Talent, Knowledge
           4) Entrepreneurship- Be innovative
                                             Be a risk taker
                         
Trade- offs
        - Alternatives that we give up whenever we choose one course of action over another

Opportunity Cost
        - Form of a trade- off
            (Next best alternative)
What is opportunity cost

Productions Possibility Curve (PPC) (PPG) (PPF)
Understanding PPC
  • Alternative ways in how to use a country's resources
  • 4 assumptions of a PPG
    1. Two Goods
      • Resources are used to produce after one or both of only 2 goods
               2.   Fixed Resources
      • Quantities of land, labor, capitol, and entrepreneurship resources do not change
              3.   Fixed Technology
      • Information and knowledge that society has about production of goods and services is fixed
               4.   Technical Efficiency
                          A is attainable but not efficient
                          B, D, C are efficient and attainable
                          X is unattainable


Efficiency - Using resources in such a way to maximize the production of goods and services

Allocative Efficiency-  The products being produced in the least costly way and this is any point on the production possibility curve

Under Utilization -
Using fewer resources than the economy is capable of using


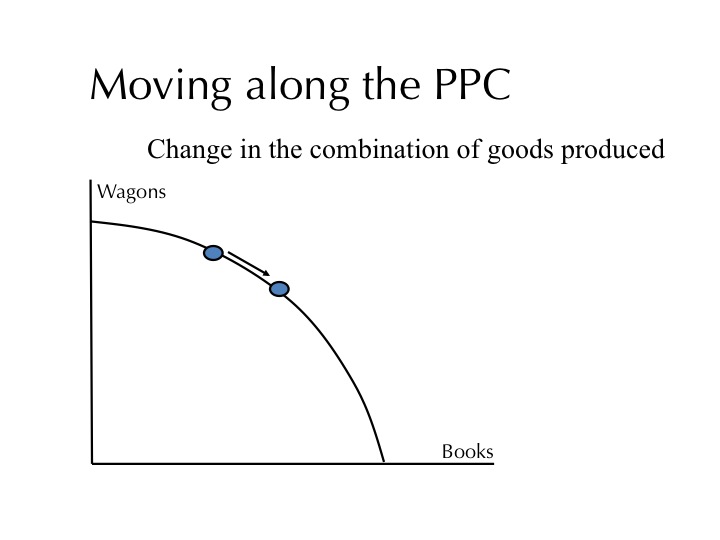
3 Types of Movement that occur within PPC
  1. Inside the PPC
  • Occurs when resources are employed or underemployed (No productive efficiency)

     2.   Along the PPC
     3.   Out of the PPC


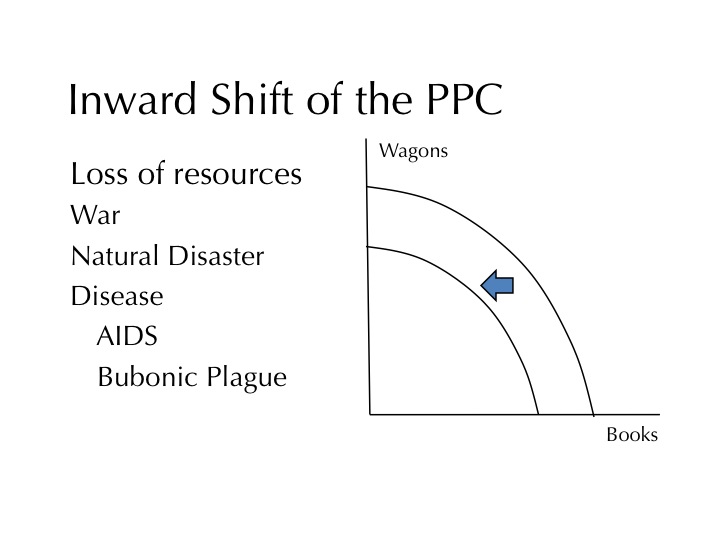
What causes PPC/ PPF to shift
  1. Technology Change
  2. Change in Resources
  3. Economic Growth
  4. Change in labor force
  5. Natural disasters / war / famine
  6. More education ( Human Capitol)
Inside Curve - Underutilization (Attainable/ Inefficient)
On Curve - Attainable + Efficient
Outside Curve - Unattainable with Current Resources